Bringing Fantasy Worlds to Life: An Unanticipated Use Case for Leaflet.js

originally posted on LinkedIn
The Wars of Light and Shadow by Janny Wurts might be the longest fantasy series you've never heard of. Spanning 11 books, 6 short stories, almost 7000 pages, and 50 years of development from outline to final published book, the series is often overshadowed by the more visible Daughter of the Empire trilogy, which Wurts co-authored with Raymond E. Feist in the 1980s.
Like all respectably chonky fantasy series, the Wars of Light and Shadow also boasts a detailed world map. This is the story of how I used open-source libraries and an iterative development cycle to bring that world map into the 21st century, offering readers a new way to explore the continent of Paravia.
When "State of the Art" Is a Moving Target
The online map of Paravia was beautifully modern upon release? in 1998. It featured Dreamweaver-generated image maps using the HTML <map> tag, allowing readers to click on different regions to go to other web pages containing larger inset maps. Images were crisp, black and white GIF files that looked spectacular on 800x600 monitors. The whole thing even worked in Internet Explorer 3!

Image maps require you to explicitly define the clickable area, making them very brittle if the map changes or your Dreamweaver license expires.
When I inherited the project, it was clear that a full modernization was needed. Web-based mapping has come a long way in 20 years and the "click around" experience that sufficed back then was too small and limiting for modern audiences. I realized that if I could implement even half of the user experience (UX) patterns that we're accustomed to today, the new map of Paravia could be incredibly immersive. I can easily dive into Google Maps, find my childhood home, see Street View pictures of my dad mowing the lawn, and even rewind time to see how it looked 10 years ago. Why not apply this to the map of a world that only exists in our imaginations?
Defining the Requirements
I spent a few days studying Google Maps, Apple Maps, and even the wizened Mapquest before capturing these basic requirements for my project:
- The map has a consistent UX on desktop, mobile, and tablet devices.
- Users can zoom in and out and move around the map without going to a different web page.
- The map has "point of interest" pins showing important locations from the books and cross-referenced with other series resources (like the author's original artwork depicting those locations and the comprehensive series wiki).
- Users can move forwards and backwards on a timeline to see how the map changes throughout the course of the story (which spans several wars and nearly 500 years).
It was actually very straightforward to meet every requirement except for the last one. The technology is there to make it happen in the future, but the data is not ? the author would need to ink additional maps showing cataclysmic, tectonic changes, like a 2nd continent laid to waste by drake fire and a 3rd continent that sank into the sea during the Second Sundering.
Prototyping
I chose Leaflet.js, an open-source JavaScript mapping library, as the backbone for the new map because of its wonderful documentation and extensibility. Though Leaflet.js is commonly used with real geospatial data, it can work with any image-based data, even a giant picture of a cat. I wrote the supporting code (PHP, CSS, and JavaScript) in IntelliJ IDEA and used Adobe Photoshop for image alterations. With this technology stack in place, I obtained a massive (10,000px width) TIFF file of the map from the author and got to work.
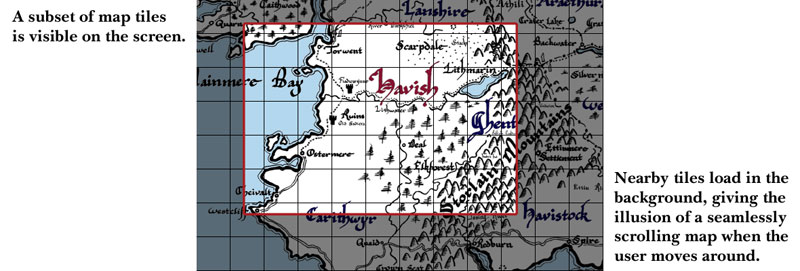
Leaflet.js works by seamlessly loading sliced up map images in the background as the user drags the map around. For example, zoom level 0 (as far away as possible to see the whole continent) is a single image that takes up the whole screen. Zoom level 1 gets a little closer, and uses 4 tiled images to render the map. My map goes up to zoom level 6, which uses 1024 tiled images to show the maximum detail possible.

Street View is not available because cameras and other technology are proscribed on this planet.
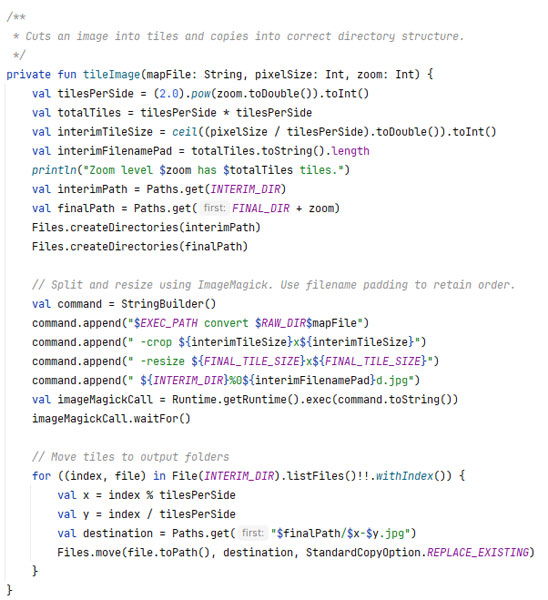
The first thing I realized was that I would probably end up doing a lot of experimentation with the map images and color palettes, and I wouldn't want to slice the map up by hand (requiring 1365 map tiles for the 6 zoom levels) every time. I added the open-source utility ImageMagick to the tech stack and wrote a small Kotlin script that automatically slices, resizes, and stores all the required map tile images with a single click.

Automate anything you're going to do more than 3 times, especially when the 3rd time is going to be years later when you've forgotten how to do it.
From here, it took only a few lines of JavaScript code to get a prototype map working. I could zoom in and out flawlessly (even with pinch gestures on touch screens) and navigate across the map simply by dragging it or using the arrow keys. These features worked out-of-the-box with Leaftlet.js and didn't require any custom code.
Adding Points of Interest
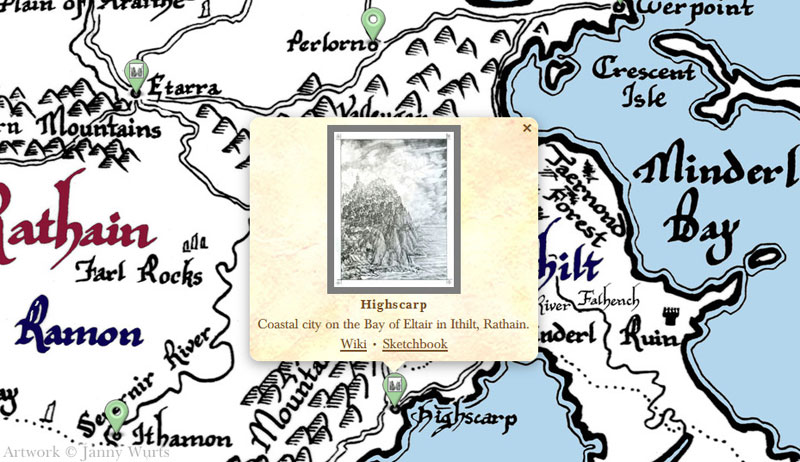
I wanted users to be able to click on towns, fortresses, and natural landmarks to learn more about them. Each point of interest has a name, a brief description, a link to a more detailed write-up in the series wiki, and (if applicable) a thumbnail of the artwork that the author had created of that location.

Clicking on the links takes the user to a full-page write-up about the location and sometimes high-resolution original artwork created by the author.
To begin, I added a special DEBUG mode to the map which displayed the current latitude and longitude whenever I click somewhere. This allowed me to click on a spot where a point of interest is supposed to go and copy/paste the coordinates into my code. I used DEBUG mode to build a list of over 120 locations, stored in the code as an array of JavaScript objects.

At this point in the development cycle, a user could open the map, zoom in on a region, and click on a point of interest to see its popup window. So far, so good!
Polish
With the primary features implemented, I started testing on different platforms and evaluating UX to figure out how to improve the minimum viable product. These are the enhancements I implemented:
- I realized that it would be nice to be able to bookmark a specific view of the map and revisit it later. I added a simple JavaScript function to update the web browser URL to include the coordinates and zoom level whenever the user moves around. Visiting the bookmark immediately loads that data and jumps to the right region.
- I realized that some of the points of interest might contain spoilers if someone hasn't gotten far in the series yet. I used Leaflet.js Layers and CSS hidden DIVs to add a Spoilers toggle, making sure the map doesn't reveal important information by accident.
Most important for usability, I noticed that the level of detail needed to decrease as the user zooms out. While it's great to have intricately detailed maps at the highest zoom level, that detail is noisy and distracting while zoomed out. It would be like Google Maps showing every street name when you're far enough away to care about the countries and continents. This was especially noticeable with points of interest, which obscured the entire map when at zoom level 0.
The fix for this was twofold: First, I created an alternate version of the map image tiles that blurred out the detail and focused on kingdom names and borders at the lowest zoom levels. Then, I adjusted the Leaflet.js Layers to only show points of interest when at higher zoom levels. This combination lets the user gradually zoom in and see more precision only when it becomes useful.

Thanks to my earlier automation, it was very simple to direct ImageMagick to slice up a different image for the lower zoom levels.
Conclusion
The entire project was completed in just 10 days, thanks to my reuse of open-source libraries. You can try out the map at the link below (and you can "View Source" in your browser to see the JavaScript code that brought it all together).
Beyond any technical interest you might have in the mapping technology, you might be interested in reading the series itself. The Wars of Light and Shadow is a challenging read that rewards your patience. It requires space and focus to savor. The prose is dense, poetic, and uniquely structured, intentionally asking you to slow down and linger over each idea. This is truly literature that I would have been much more excited to read in my high school English classes than yet another Shakespeare play.
|
tagged as
programming
|
permalink
| 0 comments
|
|
|
Previous Post: Review Day |
Next Post: Finale Day |
You are currently viewing a single post from the annals of URI! Zone history. The entire URI! Zone is © 1996 - 2024 by Brian Uri!. Please see the About page for further information.
